FFI International Group

FFI International Group
"Realeconomik Leadership"

NO EXCUSES - GET IT DONE

Featured post

#BIG #PLAYERS SEE #OIL AT $200 By 2022-End

  OILPRICE.COM Top Oil Traders See Oil Topping $200 By End-2022 By  Irina Slav  - Mar 24, 2022, A number of big oil traders now predict crud...

Search This Blog

Tuesday, 21 April 2015

SPECIAL REPORT: #5 Patterns of STOCK #MARKET CRASHES

SPECIAL REPORT

This exclusive North American article will be broken into a series of five consecutive posts providing our readers with  useful market edges and insights that are unprecedented amoung peers, into the empirical patterns behind historical and "possibly future stock market crashes." The article is sourced and supported by the author's research; having first been published earlier in renowned European journals. Applying such knowledge wisely, thereby optimizes the chances for better decisions and increased wealth - First Financial Insights, Toronto, April 2015


New Stock Market Crash, A Pattern?

Part 5 - Will The Share Indexes Go Down Any Further?

Calculating share indexes as described before and showing indexes in historical graphs is a useful way to show which stage the industrial revolution is in.


Introduction, Growth, Flourishing and Decline


<< Fig Typical course of market development >>

The third industrial revolution is clearly in the saturation and degeneration phase. This phase can be recognized by the saturation of the market and the increasing competition. Only the strongest companies can withstand the competition or take over their competitors (like for example the take-overs by Oracle and Microsoft in the past few years). The information technology world has not seen any significant technical changes recently, despite what the American marketing machine wants us to believe.

During the pre development phase and the take off phase of a transition many new companies spring into existence. This is a diverging process. Especially financial institutions play an important role here. These phases require a lot of money. The graphs showing the wages paid in the financial sector therefore shows the same S curve as both revolutions.


<<  Fig Historical excess wage in the financial sector >>

Investors get euphoric when hearing about mergers and take overs. Actually, these mergers and take overs are indications of the converging processes at the end of a transition. When looked at objectively each merger or takeover is a loss of economic activity. This becomes painfully clear when we have a look at the unemployment rates of some countries.

New industrial revolutions come about because of new ideas, inventions and discoveries, so new knowledge and insight. Here too we have reached a point of saturation. There will be fewer companies in the take off or acceleration phase to replace the companies in the index shares sets that have reached the stabilization or degeneration phase.

In the graph below we see the share price/income ratio over the past two industrial revolutions. At the end of the 2nd industrial revolution in 1932 this index reached 5. At the moment we are at 15. The index prices can still go down by a factor 3.


<< Fig industrial revolutions: share price / income ratio >>


Will history repeat itself?

Humanity is being confronted with the same problems as those at the end of the second industrial revolution such as decreasing stock exchange rates, highly increasing unemployment, towering debts of companies and governments and bad financial positions of banks.


<< Fig Two most recent revolutions: US market debt >>

Transitions are initiated by inventions and discoveries, the knowledge of mankind. New knowledge influences the other four components in a society. At the moment there are few new inventions or discoveries. So the chance of a new industrial revolution is not very high.

History has shown that five pillars are indispensable for a stable society


<< Fig The five pillars for a stable society >>

At the end of every transition the pillar Prosperity is threatened. We have seen this effect after every industrial revolution.

The pillar Prosperity of a society is about to fall again. History has shown that the fall of the pillar Prosperity always results in a revolution. Because of the high level of unemployment after the second industrial revolution many societies initiated a new transition, the creation of a war economy. This type of economy flourished especially since 1932  up to now. (i.e. US Hegemony)


Now, societies will have to make a choice for a new transition to be started. Without applied knowledge of the past there is chance for a better future, if any...


NEXT - Tomorrow... 


 ONE LAST PROFIT - CI ???
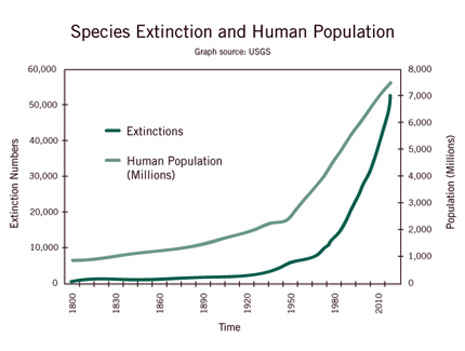
 Is This A Message? 
Why Do These Charts Trend Together?

WHO'S  NEXT?


And this happens...


COMPARE THESE CORRELATIONS: 
ANY VISUAL RELATIONSHIPS?


JUDGEMENT DAY...


ABOUT ARTICLE 

The article “A new stock market crash, a pattern?”, in dutch  "Nieuwe beurskrach, een wetmatigheid?” was published  in a magazine “Tijdschrift voor economisch onderwijs” (magazine for economical education), a monthly publication of the VECON, A union of teachers in economic and social subjects in the Netherlands. 


Wim Grommen writes: This paper advances a hypothesis of the end of the third industrial revolution and the beginning of a new transition. Every production phase or civilization or human invention goes through a so- called transformation process. Transitions are social transformation processes that cover at least one generation. In this paper I will use one such transition to demonstrate the position of our present civilization. When we consider the characteristics of the phases of a social transformation we may find ourselves at the end of what might be called the third industrial revolution. The paper describes the four most radical transitions for mankind and the effects for mankind of these transitions: the Neolithic transition, the first industrial revolution, the second industrial revolution and the third industrial revolution.

Monday, 20 April 2015

SPECIAL REPORT: #4 Patterns of STOCK #MARKET CRASHES

SPECIAL REPORT

This exclusive North American article will be broken into a series of five consecutive posts providing our readers with  useful market edges and insights that are unprecedented amoung peers, into the empirical patterns behind historical and "possibly future stock market crashes." The article is sourced and supported by the author's research; having first been published earlier in renowned European journals. Applying such knowledge wisely, thereby optimizes the chances for better decisions and increased wealth - First Financial Insights, Toronto, April 2015


New Stock Market Crash, A Pattern?

Part 4 -  Stock Index Graphs Are Fata Morganas.

What does a stock exchange index like DJIA, S&P 500 or AEX really mean?

The Dow Jones Industrial Average (DJIA) index is the oldest shares index in the United States. A select group of journalists of The Wall Street Journal decide which companies are included in the most influential stock exchange index in the world. Unlike most other indices the Dow is a price average index. This means that shares with a high price have a great influence on the movements of the index.
A History Lesson 


The S&P index is a market value index. This index, compiled by credit evaluator Standard & Poor’s, includes the 500 largest US companies, based on their market capitalization

The Amsterdam Exchange Index (AEX) is the most important stock exchange index in the Netherlands. It shows the development of share prices of the top 25 funds of the Amsterdam Stock Exchange, based on trading. The AEX is the average price of the shares of those funds.

In many graphs the y-axis is a fixed unit, such as kg, meter, liter or euro. In the graphs showing the stock exchange values, this also seems to be the case because the unit shows a number of points. However, this is far from true! An index point is not a fixed unit in time and does not have any historical significance.


An index is calculated on the basis of a set of shares. Every index has its own formula and the formula gives the number of points of the index. Unfortunately many people attach a lot of value to these graphs which are, however, very deceptive.

·        An index is calculated on the basis of a set of shares. Every index has its own formula and the formula results in the number of points of the index. However, this set of shares changes regularly. It is therefore very strange that different sets of shares are represented by the same unit.
After a period of 25 years the value of the original set of apples is compared to the value of a set of pears. At the moment only 6 of the original 30 companies that made up the set of shares of the Dow Jones at the start of the acceleration of the last revolution (in 1979) are still present.

Even more disturbing is the fact that with every change in the set of shares used to calculate the number of points, the formula also changes. This is done because the index which is the result of two different sets of shares at the moment the set is changed, must be the same for both sets at that point in time. The index graphs must be continuous lines. For example, the Dow Jones is calculated by adding the shares and dividing the result by a number. Because of changes in the set of shares and the splitting of shares the divider changes continuously. At the moment the divider is 0.132319125 but in 1985 this number was higher than 1. An index point in two periods of time is therefore calculated in different ways:

Dow 1985 = (x1 + x2 + ........+x30) / 1
Dow 2009 = (x1 + x2 + ........ + x30) / 0,132319125

In the nineties of  the last century many shares were split. To make sure the result of the calculation remained the same both the number of shares and the divider changed (which I think is wrong). An increase in share value of 1 dollar of the set of shares in 2009 results is 7.5 times more points than in 1985. The fact that in the 1990-ies many shares were split is probably the cause of the exponential growth of the Dow Jones index. At the moment the Dow is at 9665 points. If we used the 1985 formula it would be at 1279 points.

·        The most remarkable characteristic is of course the constantly changing set of shares. Generally speaking, the companies that are removed from the set are in a stabilization or degeneration phase. Companies in a take off phase or acceleration phase are added to the set. This greatly increases the chance that the index will rise rather than go down. This is obvious, especially when this is done during the acceleration phase of a transition.
This is actually a kind of pyramid scheme. All goes well as long as companies are added that are in their take off phase or acceleration phase. At the end of a transition there will be fewer companies in those phases.


<<Fig 3rd industrial revolution and the S&P 500  >>


FINAL Part #5 -  Will The Shares Go Down Any Further?


THINK - Can You Draw Blood From A Floating Rock In Space?


ABOUT ARTICLE 

The article “A new stock market crash, a pattern?”, in dutch  "Nieuwe beurskrach, een wetmatigheid?” was published  in a magazine “Tijdschrift voor economisch onderwijs” (magazine for economical education), a monthly publication of the VECON, A union of teachers in economic and social subjects in the Netherlands. 

Wim Grommen writes: This paper advances a hypothesis of the end of the third industrial revolution and the beginning of a new transition. Every production phase or civilization or human invention goes through a so- called transformation process. Transitions are social transformation processes that cover at least one generation. In this paper I will use one such transition to demonstrate the position of our present civilization. When we consider the characteristics of the phases of a social transformation we may find ourselves at the end of what might be called the third industrial revolution. The paper describes the four most radical transitions for mankind and the effects for mankind of these transitions: the Neolithic transition, the first industrial revolution, the second industrial revolution and the third industrial revolution.

Most All-timePopular Posts

DREAM BIG, ACHIEVE SMART