FFI International Group

FFI International Group
"Realeconomik Leadership"

NO EXCUSES - GET IT DONE

Featured post

#BIG #PLAYERS SEE #OIL AT $200 By 2022-End

  OILPRICE.COM Top Oil Traders See Oil Topping $200 By End-2022 By  Irina Slav  - Mar 24, 2022, A number of big oil traders now predict crud...

Search This Blog

Thursday 30 April 2015

Excessive BIG Bank Leverage Set To Wipe Out Wealth - Worst Yet!

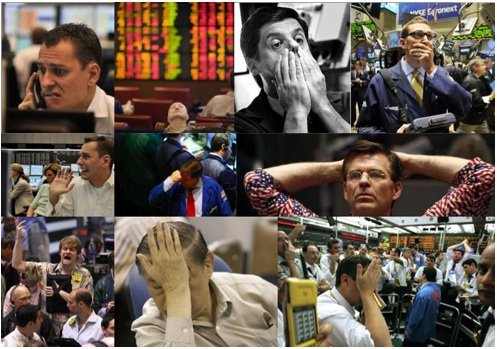
America’s biggest banks aren't ready for next meltdown


When Audited  Leverage And Risks Are Hidden IN GAAP


WASHINGTON— The main financial risk facing the United States today looks very similar to what caused so much trouble in 2007-2008: big banks with too much debt and too little equity capital on their balance sheets. Uneven global regulations, not to mention regulators who fall asleep at the wheel, compound this structural vulnerability.


We already saw this movie (see below), and it ended badly. Next time could be an even worse horror show.


All booms are different, but every major financial crisis has at its heart the same issue: major banks get into trouble and teeter on the brink of collapse. Disruption at the core of any banking system leads to tight credit, with major negative effects on the real economy. In our modern world, in which finance is interwoven throughout the economy, the consequences can be particularly severe — as we saw in 2008 and 2009. Read More.

REMEMBER 2005!
Famous Accounting Frauds - Evaporating Wealth In Virtual Moments


Platinum Wealth Partners - Top Investors Edge


Lets face it, since inception the purpose of Banks was to create liquidity in the economy through leverage of its own balance sheet. The premise for this excessive leverage was the collateral they held on the credits provided to others. But the sensibilities of this premise falls apart when credits are unsecured and leverage ratios climb to new heights by paying corrupt audit firms to create costume accounting practises. In the simple  vernacular - lies.  


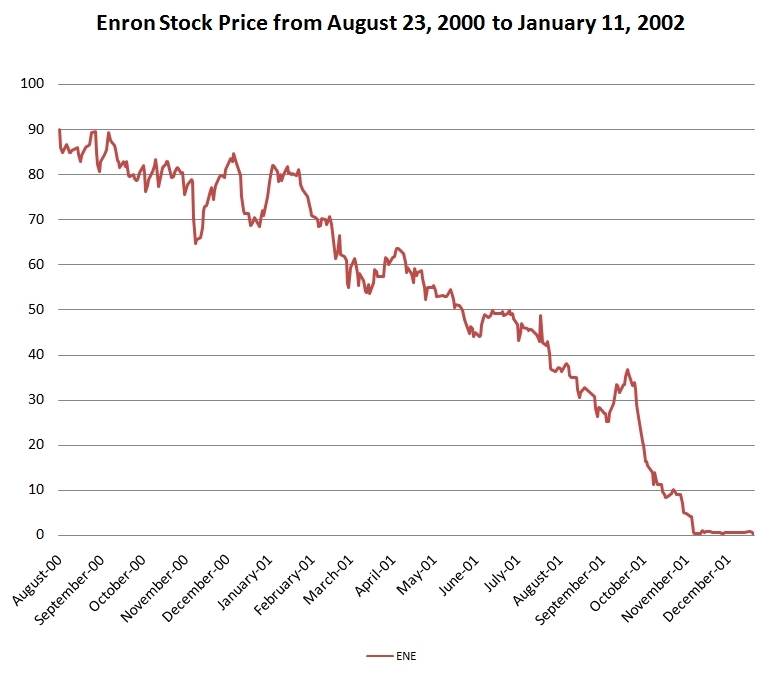
Today, as a result, the leverage in the system could be as low as 35:1 or beyond 200:1. The point being, nobody truly knows - and consequently, the street's  sense is that the financial  mathematics is now so shaky that even a slight upward rise in rates will wipe out a substantive portion of the Banks' asset and equity values - leading to a complete systemic collapse. Enron's  chart above for instance is a foreshadowing test case for the whole system that we now have in place. Not a pretty picture.


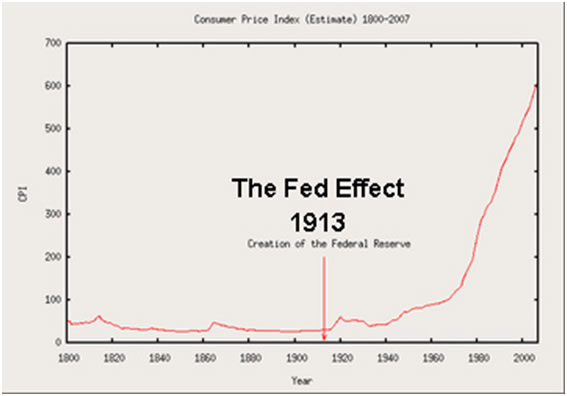
That's  why everyone  is so worried. That's why CPI needs to be manipulated. That's why the US dollar could lose its reserve  currency status. That's why no one dare raise rates by the slightest percentage. 


That's why one day all the corruption, markets and economies are mathematically boxed into an algebra articulating  the certainty of "The Mother Of All Crashes",


" One day!"


International Offices

April 30, 2015


Wednesday 29 April 2015

Are YOU Prepared For Coming #Collapse - Some Planning Ideas


Preparing For The Next Market Collapse


090121-great-depression-vmed-12p.widec.jpg


Summary

·    About two-thirds of Americans anticipate another financial crisis.
·    More are worried about a market crisis than are prepared for one.
·    Here is what works and what doesn't in a total market collapse.

It is an uncertain world and I want to be prepared


According to recent survey data from Northwestern Mutual, 67% of Americans believe that over time, there likely will be more financial crises. However, are these Americans prepared for the next one? A market collapse to be a possibility that many investors are vaguely aware of, but fewer have taken concrete steps to plan for. This is not something that I specifically expect and it is certainly not something that I hope for. It is something that I insure against in a prudent, moderate way. Read More


Why Prepare For Anything?


Platinum Wealth Partners - Top Investors Edge


There is little doubt that it makes good sense to craft back-up and disaster plans. Flexibility and prompt responsiveness, too are critical factors. Plans a,b c and so forth forth should be established.

However, one must be realistic as to what lies ahead - that could a collapse beyond all proportions and unprecedented in human and economic history.

This is our greatest fear , and its likelihood is great.

International Offices
April 29, 2015

Tuesday 28 April 2015

WALL ST Now Panicky Over #Greek Default Risk


Greek default? Wall Street Says Don't Risk It!!!


NEW YORK — Top executives on Wall Street and senior policymakers in Washington are warning their European counterparts not to let Greece default and leave the Eurozone, fearing the market reaction at a time of sluggish growth in the U.S. and instability in the global economy.


Some say they are not as freaked out as they were in 2012 about the prospect of always-in-crisis Greece getting kicked out of the Eurozone, which could happen if a deal isn’t reached quickly. Some would even like to let the Greeks go and move on with life. But then people mention Lehman Brothers. And the Russian default. And even an assassination in Sarajevo in 1914. And theoretical discussion of how better prepared the world is for a Greek exit quickly turns into fevered rumination on how it still might spark global financial Armageddon. Read More.


Greeks Seem To Be A Bit Unnerved TOO!


Platinum Wealth Partners - Top Investors Edge

It is understandable that Wall St is on edge because the global financial system is so interconnected - a proverbial house of cards. But the problem child does not show any signs of change and could quickly tumble the Eurozone; thereby trigger a roaring ripple around the globe.
.
In the end, Wall Street is not the only one suffering from anxiety attacks.


International Offices
April 28, 2015

Monday 27 April 2015

Unbelievable PLUNGE In US New Home Sales

US New-Home Sales Collapse in March


Sales of new U.S. homes plummeted in March, as the spring buying season opened with sharp declines in the Northeast and South.
The Commerce Department said Thursday that new-home sales fell 11.4 percent last month to a seasonally adjusted annual rate of 481,000. This marks a swift reversal from an annual sales pace of 543,000 in February, which had been the strongest performance in seven years.

Purchases of new homes have been volatile on a monthly basis, although sales during the first quarter of 2015 are higher than in 2014. The volatility points to a real estate market still finding its footing in the aftermath of the housing bubble that triggered the Great Recession in 2007 and the weak recovery that has followed. Read More.

Not That Long Ago 


Saturday 25 April 2015

#SPROTT MONEY - Weekly Wrap-up GREEK DEBT?

SPROTT MONEY
Weekly Wrap-up
April 25, 2015


Image result for greek debt crisis


GREEK DEBT CRISIS


 Listen to Eric Sprott share his views on this weeks release of current U.S. economic data, the Greek debt crisis and the eurogroup meeting this weekend in Riga, the farce of high frequency trading and the lack of responsible regulation, and Swiss gold exports and global demand.


 http://www.sprottmoney.com/sprott-money-weekly-wrap-up


Scrapbook photo 1Scrapbook photo 2Scrapbook photo 3Scrapbook photo 4

Friday 24 April 2015

CHINA 2015 CRISIS: State -Run Bond Defaults On Interest

Not Concerned About China’s Financial Crisis? You Should Be


In February, IVN reported on a mostly ignoredstudy claiming that the world, especially China, was at risk of default (and possible economic meltdown) because of skyrocketing debt burdens.
On Tuesday, almost all media outlets worldwide picked up on the first Chinese-state owned business allowed to default.
Struggling in a cooling economy, Baoding Tianwei Baobian Electric missed its $13.8 million interest payment due on April 21 for bonds traded within China. Even though it is a state-owned company, Beijing let them default. Read More


What if rates begin to climb too? Oh my...


Thursday 23 April 2015

China's Stock Market A Casino

Beijing 'may be playing risky game in stock rally'


THE Chinese stock market is on fire after a rally sent the benchmark equity index to a seven- year high, but experts say Beijing could be playing a risky game in its bid to revive the economy through a boost to stocks.


After a previous market crash wiped out more than US$3.5 trillion (S$4.7 trillion) from the market's 2007 peak, a new bull run has taken hold. The Shanghai index has more than doubled since the run-up began last July.
While stocks have been gaining on the back of expectations of new measures to spur the slowing Chinese economy, experts say this rally is not without a key cheerleader - Beijing itself. Read More.
Huge Rally -  Remember Japan


Tuesday 21 April 2015

SPECIAL REPORT: #5 Patterns of STOCK #MARKET CRASHES

SPECIAL REPORT

This exclusive North American article will be broken into a series of five consecutive posts providing our readers with  useful market edges and insights that are unprecedented amoung peers, into the empirical patterns behind historical and "possibly future stock market crashes." The article is sourced and supported by the author's research; having first been published earlier in renowned European journals. Applying such knowledge wisely, thereby optimizes the chances for better decisions and increased wealth - First Financial Insights, Toronto, April 2015


New Stock Market Crash, A Pattern?

Part 5 - Will The Share Indexes Go Down Any Further?

Calculating share indexes as described before and showing indexes in historical graphs is a useful way to show which stage the industrial revolution is in.


Introduction, Growth, Flourishing and Decline


<< Fig Typical course of market development >>

The third industrial revolution is clearly in the saturation and degeneration phase. This phase can be recognized by the saturation of the market and the increasing competition. Only the strongest companies can withstand the competition or take over their competitors (like for example the take-overs by Oracle and Microsoft in the past few years). The information technology world has not seen any significant technical changes recently, despite what the American marketing machine wants us to believe.

During the pre development phase and the take off phase of a transition many new companies spring into existence. This is a diverging process. Especially financial institutions play an important role here. These phases require a lot of money. The graphs showing the wages paid in the financial sector therefore shows the same S curve as both revolutions.


<<  Fig Historical excess wage in the financial sector >>

Investors get euphoric when hearing about mergers and take overs. Actually, these mergers and take overs are indications of the converging processes at the end of a transition. When looked at objectively each merger or takeover is a loss of economic activity. This becomes painfully clear when we have a look at the unemployment rates of some countries.

New industrial revolutions come about because of new ideas, inventions and discoveries, so new knowledge and insight. Here too we have reached a point of saturation. There will be fewer companies in the take off or acceleration phase to replace the companies in the index shares sets that have reached the stabilization or degeneration phase.

In the graph below we see the share price/income ratio over the past two industrial revolutions. At the end of the 2nd industrial revolution in 1932 this index reached 5. At the moment we are at 15. The index prices can still go down by a factor 3.


<< Fig industrial revolutions: share price / income ratio >>


Will history repeat itself?

Humanity is being confronted with the same problems as those at the end of the second industrial revolution such as decreasing stock exchange rates, highly increasing unemployment, towering debts of companies and governments and bad financial positions of banks.


<< Fig Two most recent revolutions: US market debt >>

Transitions are initiated by inventions and discoveries, the knowledge of mankind. New knowledge influences the other four components in a society. At the moment there are few new inventions or discoveries. So the chance of a new industrial revolution is not very high.

History has shown that five pillars are indispensable for a stable society


<< Fig The five pillars for a stable society >>

At the end of every transition the pillar Prosperity is threatened. We have seen this effect after every industrial revolution.

The pillar Prosperity of a society is about to fall again. History has shown that the fall of the pillar Prosperity always results in a revolution. Because of the high level of unemployment after the second industrial revolution many societies initiated a new transition, the creation of a war economy. This type of economy flourished especially since 1932  up to now. (i.e. US Hegemony)


Now, societies will have to make a choice for a new transition to be started. Without applied knowledge of the past there is chance for a better future, if any...


NEXT - Tomorrow... 


 ONE LAST PROFIT - CI ???

 Is This A Message? 
Why Do These Charts Trend Together?

WHO'S  NEXT?


And this happens...


COMPARE THESE CORRELATIONS: 
ANY VISUAL RELATIONSHIPS?


JUDGEMENT DAY...


ABOUT ARTICLE 

The article “A new stock market crash, a pattern?”, in dutch  "Nieuwe beurskrach, een wetmatigheid?” was published  in a magazine “Tijdschrift voor economisch onderwijs” (magazine for economical education), a monthly publication of the VECON, A union of teachers in economic and social subjects in the Netherlands


Wim Grommen writes: This paper advances a hypothesis of the end of the third industrial revolution and the beginning of a new transition. Every production phase or civilization or human invention goes through a so- called transformation process. Transitions are social transformation processes that cover at least one generation. In this paper I will use one such transition to demonstrate the position of our present civilization. When we consider the characteristics of the phases of a social transformation we may find ourselves at the end of what might be called the third industrial revolution. The paper describes the four most radical transitions for mankind and the effects for mankind of these transitions: the Neolithic transition, the first industrial revolution, the second industrial revolution and the third industrial revolution.

Monday 20 April 2015

SPECIAL REPORT: #4 Patterns of STOCK #MARKET CRASHES

SPECIAL REPORT

This exclusive North American article will be broken into a series of five consecutive posts providing our readers with  useful market edges and insights that are unprecedented amoung peers, into the empirical patterns behind historical and "possibly future stock market crashes." The article is sourced and supported by the author's research; having first been published earlier in renowned European journals. Applying such knowledge wisely, thereby optimizes the chances for better decisions and increased wealth - First Financial Insights, Toronto, April 2015


New Stock Market Crash, A Pattern?

Part 4 -  Stock Index Graphs Are Fata Morganas.

What does a stock exchange index like DJIA, S&P 500 or AEX really mean?

The Dow Jones Industrial Average (DJIA) index is the oldest shares index in the United States. A select group of journalists of The Wall Street Journal decide which companies are included in the most influential stock exchange index in the world. Unlike most other indices the Dow is a price average index. This means that shares with a high price have a great influence on the movements of the index.
A History Lesson 


The S&P index is a market value index. This index, compiled by credit evaluator Standard & Poor’s, includes the 500 largest US companies, based on their market capitalization

The Amsterdam Exchange Index (AEX) is the most important stock exchange index in the Netherlands. It shows the development of share prices of the top 25 funds of the Amsterdam Stock Exchange, based on trading. The AEX is the average price of the shares of those funds.

In many graphs the y-axis is a fixed unit, such as kg, meter, liter or euro. In the graphs showing the stock exchange values, this also seems to be the case because the unit shows a number of points. However, this is far from true! An index point is not a fixed unit in time and does not have any historical significance.


An index is calculated on the basis of a set of shares. Every index has its own formula and the formula gives the number of points of the index. Unfortunately many people attach a lot of value to these graphs which are, however, very deceptive.

·        An index is calculated on the basis of a set of shares. Every index has its own formula and the formula results in the number of points of the index. However, this set of shares changes regularly. It is therefore very strange that different sets of shares are represented by the same unit.
After a period of 25 years the value of the original set of apples is compared to the value of a set of pears. At the moment only 6 of the original 30 companies that made up the set of shares of the Dow Jones at the start of the acceleration of the last revolution (in 1979) are still present.

Even more disturbing is the fact that with every change in the set of shares used to calculate the number of points, the formula also changes. This is done because the index which is the result of two different sets of shares at the moment the set is changed, must be the same for both sets at that point in time. The index graphs must be continuous lines. For example, the Dow Jones is calculated by adding the shares and dividing the result by a number. Because of changes in the set of shares and the splitting of shares the divider changes continuously. At the moment the divider is 0.132319125 but in 1985 this number was higher than 1. An index point in two periods of time is therefore calculated in different ways:

Dow 1985 = (x1 + x2 + ........+x30) / 1
Dow 2009 = (x1 + x2 + ........ + x30) / 0,132319125

In the nineties of  the last century many shares were split. To make sure the result of the calculation remained the same both the number of shares and the divider changed (which I think is wrong). An increase in share value of 1 dollar of the set of shares in 2009 results is 7.5 times more points than in 1985. The fact that in the 1990-ies many shares were split is probably the cause of the exponential growth of the Dow Jones index. At the moment the Dow is at 9665 points. If we used the 1985 formula it would be at 1279 points.

·        The most remarkable characteristic is of course the constantly changing set of shares. Generally speaking, the companies that are removed from the set are in a stabilization or degeneration phase. Companies in a take off phase or acceleration phase are added to the set. This greatly increases the chance that the index will rise rather than go down. This is obvious, especially when this is done during the acceleration phase of a transition.
This is actually a kind of pyramid scheme. All goes well as long as companies are added that are in their take off phase or acceleration phase. At the end of a transition there will be fewer companies in those phases.


<<Fig 3rd industrial revolution and the S&P 500  >>


FINAL Part #5 -  Will The Shares Go Down Any Further?


THINK - Can You Draw Blood From A Floating Rock In Space?


ABOUT ARTICLE 

The article “A new stock market crash, a pattern?”, in dutch  "Nieuwe beurskrach, een wetmatigheid?” was published  in a magazine “Tijdschrift voor economisch onderwijs” (magazine for economical education), a monthly publication of the VECON, A union of teachers in economic and social subjects in the Netherlands

Wim Grommen writes: This paper advances a hypothesis of the end of the third industrial revolution and the beginning of a new transition. Every production phase or civilization or human invention goes through a so- called transformation process. Transitions are social transformation processes that cover at least one generation. In this paper I will use one such transition to demonstrate the position of our present civilization. When we consider the characteristics of the phases of a social transformation we may find ourselves at the end of what might be called the third industrial revolution. The paper describes the four most radical transitions for mankind and the effects for mankind of these transitions: the Neolithic transition, the first industrial revolution, the second industrial revolution and the third industrial revolution.

Most All-timePopular Posts

DREAM BIG, ACHIEVE SMART

Blog Archive