Over 1.5 Million International Followers and Readers have engaged our various curated digests which provides Insights and Ideas from leading global investors, economists, scientists, experts and media; focusing on Humanity's "BIG 7 Es" as they pertain to individual wealth issues. Meshing the best and brightest minds to provide our world leading - - "INVEST DIFFERENT" - Stayin the Know, Ahead of Markets, Decide Wisely...
·About two-thirds of Americans anticipate
another financial crisis.
·More are worried about a market crisis
than are prepared for one.
·Here is what works and what doesn't in a
total market collapse.
It is an uncertain world and I want to
be prepared
According to recent survey data from Northwestern
Mutual, 67% of Americans believe that over time, there likely will be more
financial crises. However, are these Americans prepared for the next one? A
market collapse to be a possibility that many investors are vaguely aware of,
but fewer have taken concrete steps to plan for. This is not something that I
specifically expect and it is certainly not something that I hope for. It is
something that I insure against in a prudent, moderate way. Read More
Why Prepare For Anything?
Platinum Wealth Partners - Top Investors Edge
There is little doubt that it makes good sense to craft back-up and disaster plans. Flexibility and prompt responsiveness, too are critical factors. Plans a,b c and so forth forth should be established.
However, one must be realistic as to what lies ahead - that could a collapse beyond all proportions and unprecedented in human and economic history.
This is our greatest fear , and its likelihood is great.
This exclusive North American article will be broken into a series of five consecutive posts providing our readers with useful market edges and insights that are unprecedented amoung peers, into the empirical patterns behind historical and "possibly future stock market crashes." The article is sourced and supported by the author's research; having first been published earlier in renowned European journals. Applying such knowledge wisely, thereby optimizes the chances for better decisions and increased wealth - First Financial Insights, Toronto, April 2015
New Stock Market Crash, A Pattern? Part 5 - Will The Share Indexes Go Down Any Further?
Calculating share indexes as described before and showing indexes in historical graphs is a useful way to show which stage the industrial revolution is in.
Introduction, Growth, Flourishing and Decline
<< Fig Typical course of market development >>
The third industrial revolution is clearly in the saturation and degeneration phase. This phase can be recognized by the saturation of the market and the increasing competition. Only the strongest companies can withstand the competition or take over their competitors (like for example the take-overs by Oracle and Microsoft in the past few years). The information technology world has not seen any significant technical changes recently, despite what the American marketing machine wants us to believe.
During the pre development phase and the take off phase of a transition many new companies spring into existence. This is a diverging process. Especially financial institutions play an important role here. These phases require a lot of money. The graphs showing the wages paid in the financial sector therefore shows the same S curve as both revolutions.
<< Fig Historical excess wage in the financial sector >>
Investors get euphoric when hearing about mergers and take overs. Actually, these mergers and take overs are indications of the converging processes at the end of a transition. When looked at objectively each merger or takeover is a loss of economic activity. This becomes painfully clear when we have a look at the unemployment rates of some countries.
New industrial revolutions come about because of new ideas, inventions and discoveries, so new knowledge and insight. Here too we have reached a point of saturation. There will be fewer companies in the take off or acceleration phase to replace the companies in the index shares sets that have reached the stabilization or degeneration phase.
In the graph below we see the share price/income ratio over the past two industrial revolutions. At the end of the 2nd industrial revolution in 1932 this index reached 5. At the moment we are at 15. The index prices can still go down by a factor 3.
<< Fig industrial revolutions: share price / income ratio >>
Will history repeat itself?
Humanity is being confronted with the same problems as those at the end of the second industrial revolution such as decreasing stock exchange rates, highly increasing unemployment, towering debts of companies and governments and bad financial positions of banks.
<< Fig Two most recent revolutions: US market debt >>
Transitions are initiated by inventions and discoveries, the knowledge of mankind. New knowledge influences the other four components in a society. At the moment there are few new inventions or discoveries. So the chance of a new industrial revolution is not very high.
History has shown that five pillars are indispensable for a stable society
<< Fig The five pillars for a stable society >>
At the end of every transition the pillar Prosperity is threatened. We have seen this effect after every industrial revolution.
The pillar Prosperity of a society is about to fall again. History has shown that the fall of the pillar Prosperity always results in a revolution. Because of the high level of unemployment after the second industrial revolution many societies initiated a new transition, the creation of a war economy. This type of economy flourished especially since 1932 up to now. (i.e. US Hegemony)
Now, societies will have to make a choice for a new transition to be started. Without applied knowledge of the past there is chance for a better future, if any...
NEXT - Tomorrow...
ONE LAST PROFIT - CI ???
Is This A Message? Why Do These Charts Trend Together? WHO'S NEXT?
And this happens...
COMPARE THESE CORRELATIONS: ANY VISUAL RELATIONSHIPS?
JUDGEMENT DAY...
ABOUT ARTICLE
The article “A new stock market crash, a pattern?”, in dutch "Nieuwe beurskrach, een wetmatigheid?” was published in a magazine “Tijdschrift voor economisch onderwijs” (magazine for economical education), a monthly publication of the VECON, A union of teachers in economic and social subjects in the Netherlands.
Wim Grommen writes: This paper advances a hypothesis of the end of the third industrial revolution and the beginning of a new transition. Every production phase or civilization or human invention goes through a so- called transformation process. Transitions are social transformation processes that cover at least one generation. In this paper I will use one such transition to demonstrate the position of our present civilization. When we consider the characteristics of the phases of a social transformation we may find ourselves at the end of what might be called the third industrial revolution. The paper describes the four most radical transitions for mankind and the effects for mankind of these transitions: the Neolithic transition, the first industrial revolution, the second industrial revolution and the third industrial revolution.
This exclusive North American article will be broken into a series of five consecutive posts providing our readers with useful market edges and insights that are unprecedented amoung peers, into the empirical patterns behind historical and "possibly future stock market crashes." The article is sourced and supported by the author's research; having first been published earlier in renowned European journals. Applying such knowledge wisely, thereby optimizes the chances for better decisions and increased wealth - First Financial Insights, Toronto, April 2015
New Stock Market Crash, A Pattern? Part 4 -Stock Index Graphs Are Fata Morganas.
What does a stock exchange index like DJIA, S&P 500 or AEX really mean?
The Dow Jones Industrial Average (DJIA) index is the oldest shares index in the United States. A select group of journalists of The Wall Street Journal decide which companies are included in the most influential stock exchange index in the world. Unlike most other indices the Dow is a price average index. This means that shares with a high price have a great influence on the movements of the index.
A History Lesson
The S&P index is a market value index. This index, compiled by credit evaluator Standard & Poor’s, includes the 500 largest US companies, based on their market capitalization
The Amsterdam Exchange Index (AEX) is the most important stock exchange index in the Netherlands. It shows the development of share prices of the top 25 funds of the Amsterdam Stock Exchange, based on trading. The AEX is the average price of the shares of those funds.
In many graphs the y-axis is a fixed unit, such as kg, meter, liter or euro. In the graphs showing the stock exchange values, this also seems to be the case because the unit shows a number of points. However, this is far from true! An index point is not a fixed unit in time and does not have any historical significance.
An index is calculated on the basis of a set of shares. Every index has its own formula and the formula gives the number of points of the index. Unfortunately many people attach a lot of value to these graphs which are, however, very deceptive.
·An index is calculated on the basis of a set of shares. Every index has its own formula and the formula results in the number of points of the index. However, this set of shares changes regularly. It is therefore very strange that different sets of shares are represented by the same unit. After a period of 25 years the value of the original set of apples is compared to the value of a set of pears. At the moment only 6 of the original 30 companies that made up the set of shares of the Dow Jones at the start of the acceleration of the last revolution (in 1979) are still present.
Even more disturbing is the fact that with every change in the set of shares used to calculate the number of points, the formula also changes. This is done because the index which is the result of two different sets of shares at the moment the set is changed, must be the same for both sets at that point in time. The index graphs must be continuous lines. For example, the Dow Jones is calculated by adding the shares and dividing the result by a number. Because of changes in the set of shares and the splitting of shares the divider changes continuously. At the moment the divider is 0.132319125 but in 1985 this number was higher than 1. An index point in two periods of time is therefore calculated in different ways:
In the nineties of the last century many shares were split. To make sure the result of the calculation remained the same both the number of shares and the divider changed (which I think is wrong). An increase in share value of 1 dollar of the set of shares in 2009 results is 7.5 times more points than in 1985. The fact that in the 1990-ies many shares were split is probably the cause of the exponential growth of the Dow Jones index. At the moment the Dow is at 9665 points. If we used the 1985 formula it would be at 1279 points.
·The most remarkable characteristic is of course the constantly changing set of shares. Generally speaking, the companies that are removed from the set are in a stabilization or degeneration phase. Companies in a take off phase or acceleration phase are added to the set. This greatly increases the chance that the index will rise rather than go down. This is obvious, especially when this is done during the acceleration phase of a transition. This is actually a kind of pyramid scheme. All goes well as long as companies are added that are in their take off phase or acceleration phase. At the end of a transition there will be fewer companies in those phases.
<<Fig 3rd industrial revolution and the S&P 500 >>
FINAL Part #5 - Will The Shares Go Down Any Further?
THINK - Can You Draw Blood From A Floating Rock In Space?
ABOUT ARTICLE
The article “A new stock market crash, a pattern?”, in dutch "Nieuwe beurskrach, een wetmatigheid?” was published in a magazine “Tijdschrift voor economisch onderwijs” (magazine for economical education), a monthly publication of the VECON, A union of teachers in economic and social subjects in the Netherlands. Wim Grommen writes: This paper advances a hypothesis of the end of the third industrial revolution and the beginning of a new transition. Every production phase or civilization or human invention goes through a so- called transformation process. Transitions are social transformation processes that cover at least one generation. In this paper I will use one such transition to demonstrate the position of our present civilization. When we consider the characteristics of the phases of a social transformation we may find ourselves at the end of what might be called the third industrial revolution. The paper describes the four most radical transitions for mankind and the effects for mankind of these transitions: the Neolithic transition, the first industrial revolution, the second industrial revolution and the third industrial revolution.
This exclusive North American article will be broken into a series of five consecutive posts providing our readers with useful market edges and insights that are unprecedented amoung peers, into the empirical patterns behind historical and "possibly future stock market crashes." The article is sourced and supported by the author's research; having first been published earlier in renowned European journals. Applying such knowledge wisely, thereby optimizes the chances for better decisions and increased wealth - First Financial Insights, Toronto, April 2015
New stock market crash, a pattern? Part 3 - Three Drastic Transitions
Three Drastic Transitions
When we go back into the past, three transitions took place with far-reaching effects.
The First Industrial Revolution
The first industrial revolution lasted from around 1780 tot 1850. It was characterized by a transition from small scale handwork to mechanized production in factories. The great catalyst in the process was the steam engine which also caused a revolution in transport as it was used in railways and shipping. The first industrial revolution was centered around the cotton industry. Because steam engines were made of iron and ran on coal, both coal mining and iron industry also came to bloom.
This revolution ended in 1845 when Friedrich Engels, son of a German textile baron, described the living conditions of the English working class in “The condition of the working class in England“. The result of this revolution: an immense gap between rich and poor.
A New Philosophy Intoxicates Human Ideas, Systems And Deeds
The Second Industrial Revolution
The second industrial revolution started around 1870 and ended around 1930. It was characterized by ongoing mechanization because of the introduction of the assembly line, the replacement of iron by steel and the development of the chemical industry. Furthermore coal and water were replaced by oil and electricity and the internal combustion engine was developed. Whereas the first industrial revolution was started through (chance) inventions by amateurs, companies invested a lot of money in professional research during the second revolution, looking for new products and production methods. In search of finances small companies merged into large scale enterprises which were headed by professional managers and shares were put on the market. These developments caused the transition from the traditional family business to Limited Liability companies and multinationals.
Consumerism Transforms Into Religiosity
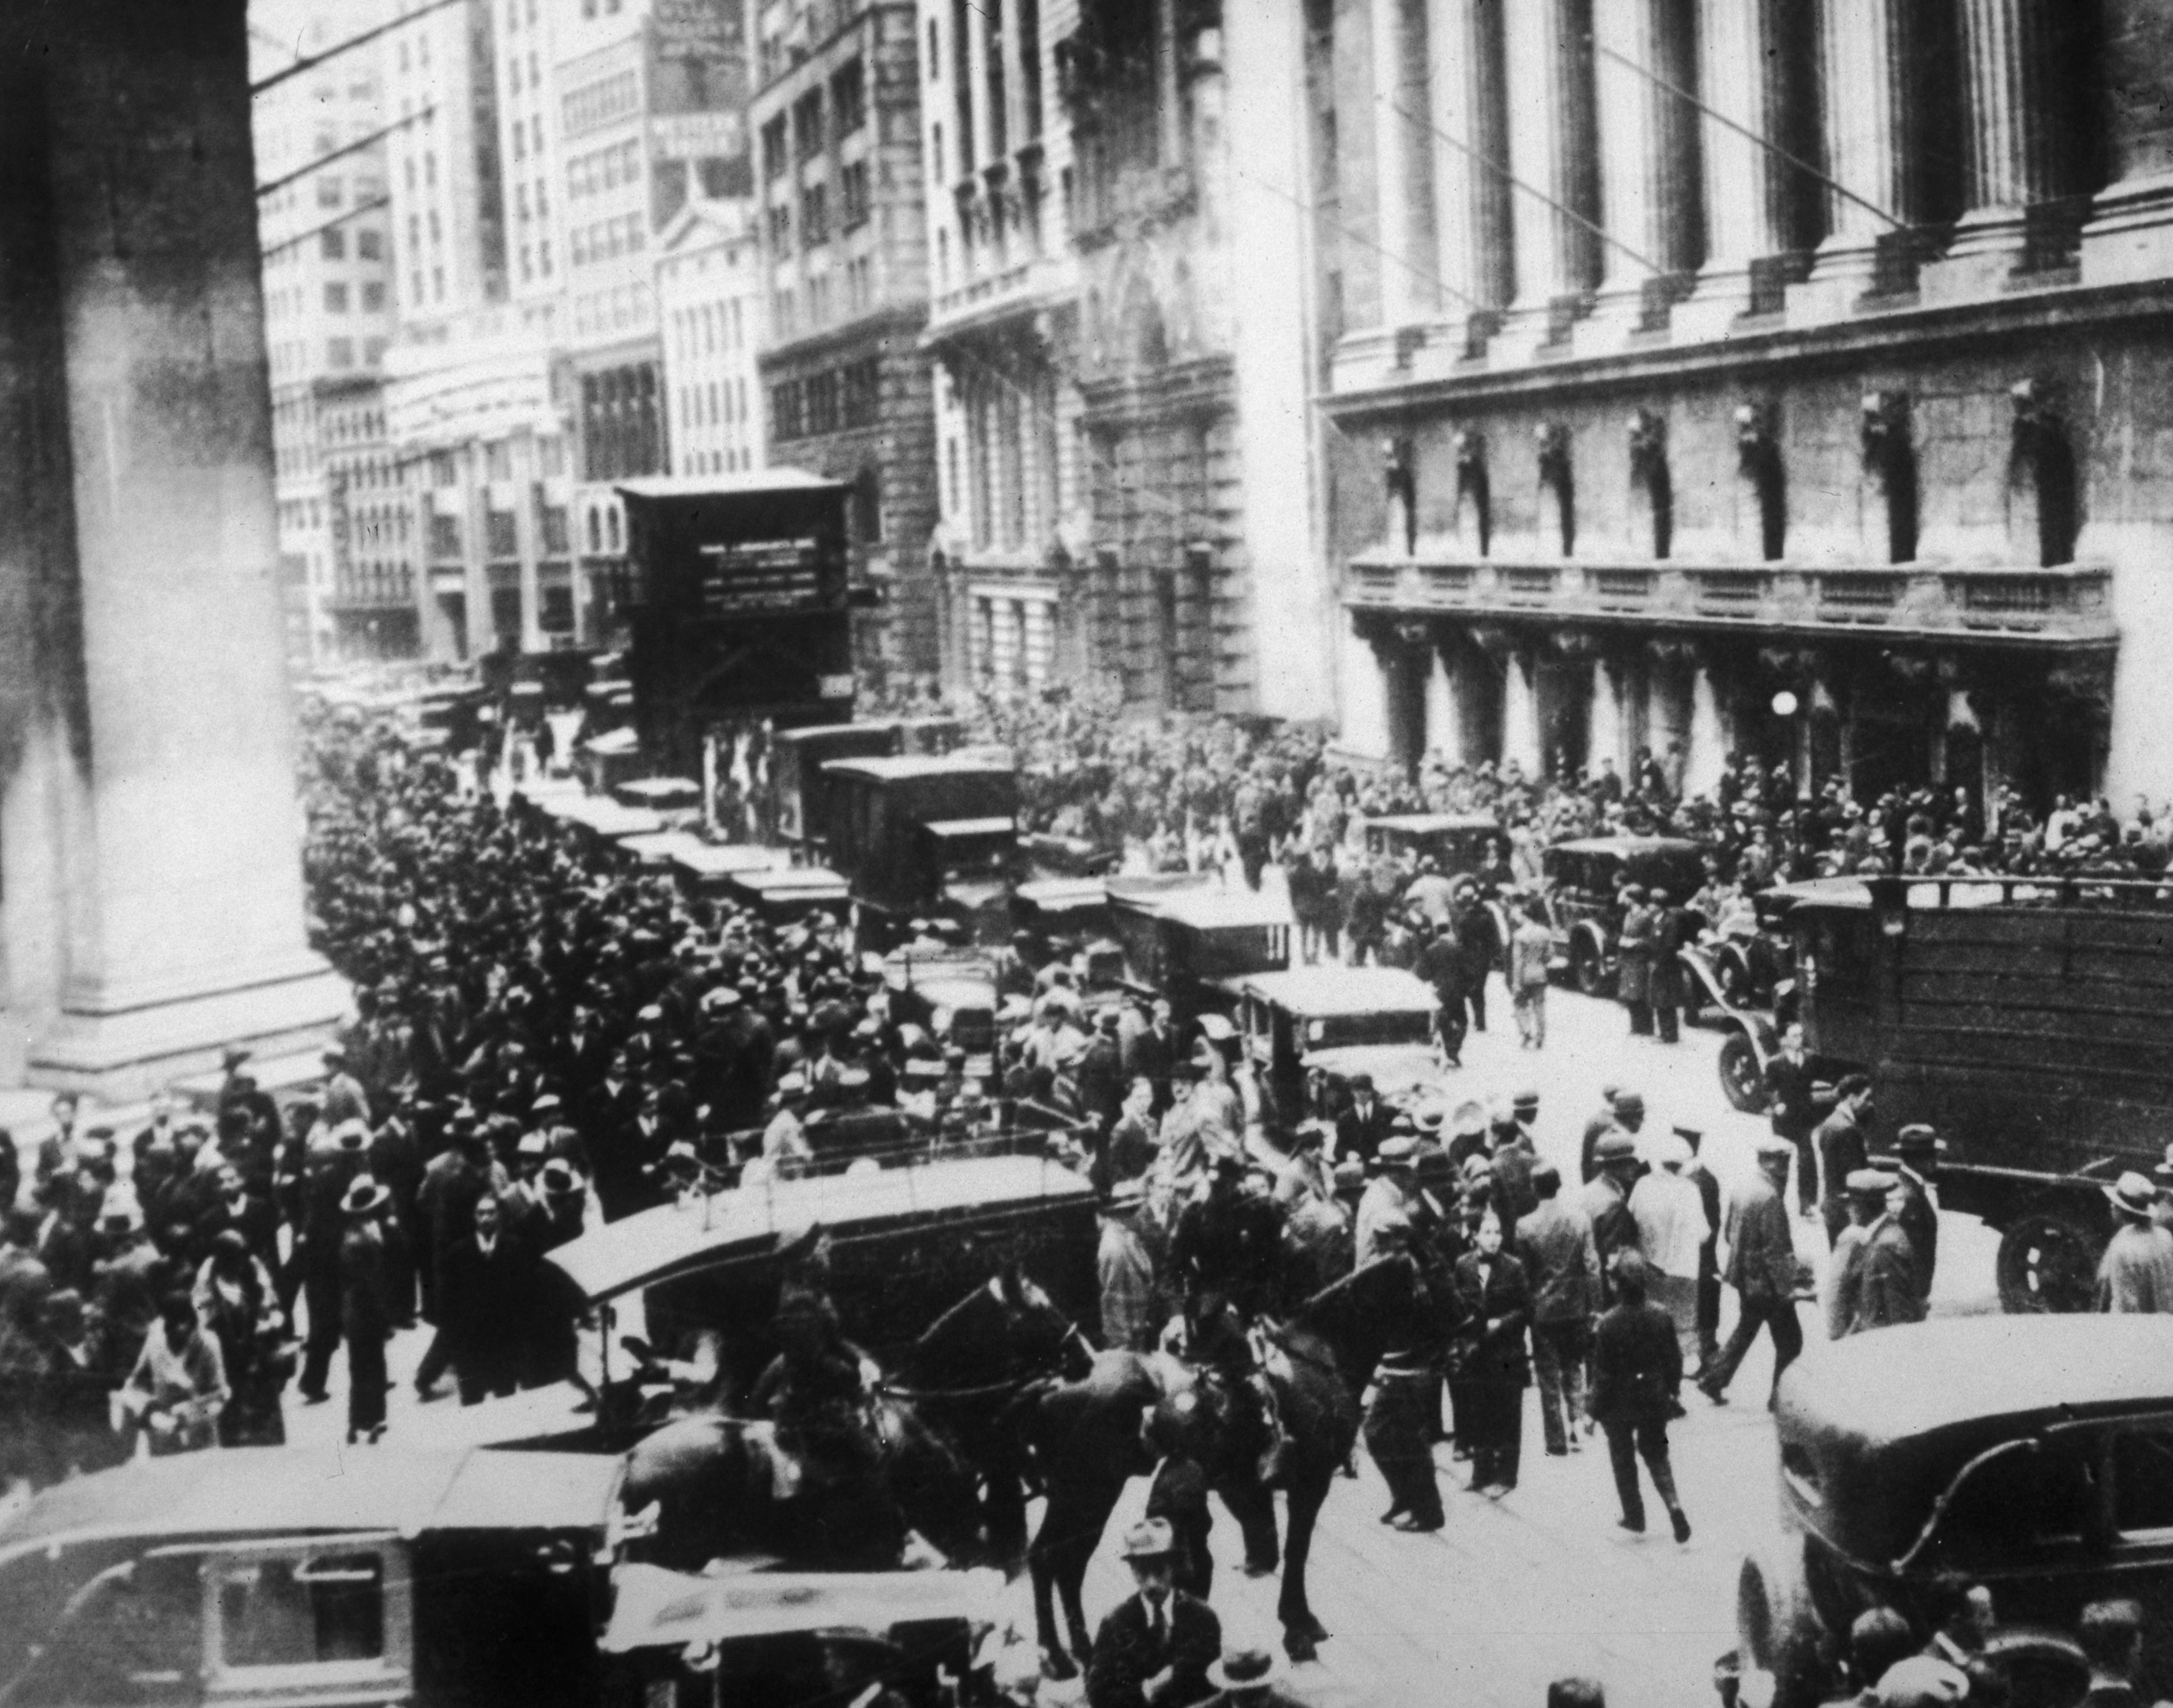
After the roaring twenties the revolution ended with the stock exchange crash of 1929. The consequences were disastrous culminating in the Second World War.
The Third Industrial Revolution
The third industrial revolution started around 1940 and is nearing its end. The United States and Japan played a leading role in the development of computers. During the Second World War great efforts were made to apply computer technology to military purposes. After the war the American space program increased the number of applications. Japan specialized in the use of computers for industrial purposes such as the robot. By now the computer and communication technology take up an irreplaceable role in all parts of the world.
How Long Can We Continue Making Stuff?
The acceleration phase of the third industrial revolution started around 1980 with the introduction of the micro processor. The third industrial revolution has clearly reached the saturation and degeneration phase.
Dow Jones Industrial Average
<< Fig Exchange rates of Dow Jones during the latest two industrial revolutions. During the last few years the rate increases have accelerated enormously.>>
NEXT Part #4 - Stock Index Graphs Are Fata Morganas.
THINK: Possible Train Wreck Ahead?
ABOUT ARTICLE
Wim Grommen writes: This paper advances a hypothesis of the end of the third industrial revolution and the beginning of a new transition. Every production phase or civilization or human invention goes through a so- called transformation process. Transitions are social transformation processes that cover at least one generation. In this paper I will use one such transition to demonstrate the position of our present civilization. When we consider the characteristics of the phases of a social transformation we may find ourselves at the end of what might be called the third industrial revolution. The paper describes the four most radical transitions for mankind and the effects for mankind of these transitions: the Neolithic transition, the first industrial revolution, the second industrial revolution and the third industrial revolution. The article “A new stock market crash, a pattern?”, in dutch "Nieuwe beurskrach, een wetmatigheid?” was published in a magazine “Tijdschrift voor economisch onderwijs” (magazine for economical education), a monthly publication of the VECON, A union of teachers in economic and social subjects in the Netherlands.
This exclusive North American article will be broken into a series of five consecutive posts providing our readers with useful market edges and insights that are unprecedented amoung peers, into the empirical patterns behind historical and "possibly future stock market crashes." The article is sourced and supported by the author's research; having first been published earlier in renowned European journals. Applying such knowledge wisely, thereby optimizes the chances for better decisions and increased wealth - First Financial Insights, Toronto, April 2015
New stock market crash, a pattern? Part 2 - The S-Curve of Transition
Examples of historical transitions are -
the demographic transition and the transition from coal to natural gas which caused transition in the use of energy. A transition process is not fixed from the start because during the transition processes will adapt to the new situation. A transition is not dogmatic.
Can We More To A Sustainable System?
Four transition phases -
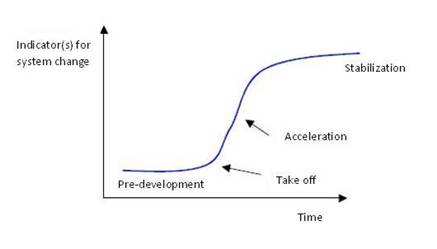
In general transitions can be seen to go through the S curve and we can distinguish four phases (see fig. 1):
1.a pre development phase of a dynamic balance in which the present status does not visibly change
2.a take off phase in which the process of change starts because of changes in the system
3.an acceleration phase in which visible structural changes take place through an accumulation of socio cultural, economical, ecological and institutional changes influencing each other; in this phase we see collective learning processes, diffusion and processes of embedding
4.a stabilization phase in which the speed of sociological change slows down and a new dynamic balance is achieved through learning
A product life cycle also goes through an S curve. In that case there is a fifth phase:
5.the degeneration phase in which cost rises because of over capacity and the producer will finally withdraw from the market.
The S curve of a transition:
<< Fig Four phases in a transition best visualized by means of an S curve.>>
NEXT Part #3 - Three Drastic Transitions
THINK - is anything really too big to fail?
ABOUT ARTICLE
Wim Grommen writes: This paper advances a hypothesis of the end of the third industrial revolution and the beginning of a new transition. Every production phase or civilization or human invention goes through a so- called transformation process. Transitions are social transformation processes that cover at least one generation. In this paper I will use one such transition to demonstrate the position of our present civilization. When we consider the characteristics of the phases of a social transformation we may find ourselves at the end of what might be called the third industrial revolution. The paper describes the four most radical transitions for mankind and the effects for mankind of these transitions: the Neolithic transition, the first industrial revolution, the second industrial revolution and the third industrial revolution. The article “A new stock market crash, a pattern?”, in dutch "Nieuwe beurskrach, een wetmatigheid?” was published in a magazine “Tijdschrift voor economisch onderwijs” (magazine for economical education), a monthly publication of the VECON, A union of teachers in economic and social subjects in the Netherlands.
This exclusive North American article will be broken into a series of five consecutive posts providing our readers with useful market edges and insights that are unprecedented amoung peers, into the empirical patterns behind historical and "possibly future stock market crashes." The article is sourced and supported by the author's research; having first been published earlier in renowned European journals. Applying such knowledge wisely, thereby optimizes the chances for better decisions and increased wealth - First Financial Insights, Toronto, April 2015
New stock market crash, a pattern?
Every production phase or civilization or other human invention goes through a so called transformation process. Transitions are social transformation processes that cover at least one generation. In this article I will use one such transition to demonstrate the position of our present civilization and its possible effect on stock exchange rates.
When we consider the characteristics of the phases of a social transformation we may find ourselves at the end of what might be called the third industrial revolution. Transitions are social transformation processes that cover at least one generation (= 25 years). A transition has the following characteristics:
-it involves a structural change of civilization or a complex subsystem of our civilization
-it shows technological, economical, ecological, socio cultural and institutional changes at different levels that influence and enhance each other
-it is the result of slow changes (changes in supplies) and fast dynamics (flows)
Examples of historical transitions are the demographic transition and the transition from coal to natural gas which caused transition in the use of energy. A transition process is not fixed from the start because during the transition processes will adapt to the new situation. A transition is not dogmatic.
TO BE CONT...
CAN IT HAPPEN AGAIN ?
The article “A new stock market crash, a pattern?”, in dutch "Nieuwe beurskrach, een wetmatigheid?” was published in a magazine “Tijdschrift voor economisch onderwijs” (magazine for economical education), a monthly publication of the VECON, A union of teachers in economic and social subjects in the Netherlands.
Indian Capital market has closed at a all time high on back of strong performance from Banking, Capital Goods. We feel that market will continue to gain , but , feel that larger gain will now come from Midcap & small cap stocks. One should now focus on quality midcap stocks & with strong fundamental. One should not ,now, gets carried away by return & should focus on quality midcaps. We feel that Most of the midcaps stocks has supporting technical the valuation gap between large cap and Mid cap stocks has gone up. So we are presenting few idea generated by Axis Capital, CLSA and India Infoline. Read More
Bull on Run, Or Bear in Woods
Platinim Advice:
India like all global markets is over-heated and headed for a correction. Small caps generally offer huge rewards on the way up, but offer greater opportunities when it slides to the savy short-player. Our bets would be on the short side for those good at homework.
Be wary when you hear ‘this is the big stock crash’
By L.A. Little
Market commentators love to make the big call: market crash. As soon as there is a sign of general market weakness, they come out of the woodwork with their crash calls. Perennial doom commentators like Marc Faber, Harry Dent and others were on the airwaves last week talking up the fear of the impending meltdown. If you go back through history, that's how you get famous.
You repeat your bear calls each time the market wobbles, calling for a huge decline, and if it develops while your call is still fresh, then six months down the road you are a guru — set up to live off your 15 minutes of fame for the rest of your life.
Of course, these big macro gloom-and-doom calls do nothing for the average investor/trader. In fact, one could easily make the case that they do far more harm than good, since they are wrong 99% of the time, and anyone who acts on the crash calls typically ends up liquidating what are likely well-positioned longs at inopportune times.
It all ended in 2013?
So are the crash callers right this time around? Is this that 1% case where you really should sell everything finally and hunker down? Is this the big meltdown that has been repeatedly called fo?r
In
short, it is doubtful, and even if it is, it will take more time to
create the structure needed for it to happen. How can one say that with
confidence? What is meant by that statement? Many detractors suggest
that one cannot know when a sell off is imminent and with that, I agree.
Imminent implies one can call both direction and timing correctly. That
is not possible with any reasonable degree of accuracy.
Great
to hear and read a balanced insight on the markets - and generally
reality. Anyone who has been in the markets knows by now they
are not always rationale, and guru's are right only some of the time,
you will never hear about their mistakes thatare promptly buried in the
"oops" archives.
Let's face it, most these guys - Rogers, Dent, Faber, and others are financial entertainers. and that includes the cable networks - Cramer; as well. There are mostly actors, comedians and promoters bestowing modern day snake oil to any one foolish enough to listen. J. T. Barnum's patrons.